Climate indicator products
Home > Climate indicator products
Other glacier products:
Glacier photos
, Glacier lake outburst floods
Storbreen - 2636

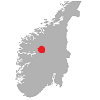
Storbreen (Storbrean) is situated in the Jotunheimen mountain massif in central southern Norway. The glacier has relatively well-defined borders and is surrounded by high peaks. Mass balance has been measured since 1949, length change since 1902.
Click here for more information about the glacier.LIA - 2019
| Year | area (km²) |
Source |
|---|---|---|
| LIA | 7.17 | LIA-morain |
| 1935 | 6.05 | Gradteigskart' |
| 1940 | 5.96 | Glacier map |
| 1951 | 5.73 | Glacier map |
| 1968 | 5.6 | Glacier map |
| 1981 | 5.16 | N50 |
| 1984 | 5.35 | Glacier map |
| 1997 | 5.36 | Glacier map |
| 2003 | 5.21 | Landsat |
| 2009 | 5.14 | Orthophoto |
| 2019 | 4.88 | Orthophoto |
1902 - 2023
| Year | Length change (m) | Cumulative length change (m) |
|---|---|---|
| 1902 | 0 | Start |
| 1904 | -27 | -27 |
| 1905 | -7 | -34 |
| 1906 | -22 | -56 |
| 1907 | 9 | -47 |
| 1909 | -17 | -64 |
| 1910 | 12 | -52 |
| 1911 | -35 | -87 |
| 1912 | -10 | -97 |
| 1919 | -59 | -156 |
| 1933 | -66 | -222 |
| 1934 | -23 | -245 |
| 1935 | -15 | -260 |
| 1936 | -42 | -302 |
| 1937 | -26 | -328 |
| 1938 | -44 | -372 |
| 1939 | -23 | -395 |
| 1941 | -43 | -438 |
| 1942 | -5 | -443 |
| 1943 | -1 | -444 |
| 1944 | -14 | -458 |
| 1945 | -18 | -476 |
| 1946 | -43 | -519 |
| 1947 | -25 | -544 |
| 1948 | -60 | -604 |
| 1949 | -13 | -617 |
| 1950 | -36 | -653 |
| 1951 | -16 | -669 |
| 1952 | -9 | -678 |
| 1953 | -20 | -698 |
| 1954 | -18 | -716 |
| 1955 | -13 | -729 |
| 1956 | -15 | -744 |
| 1957 | -20 | -764 |
| 1959 | -40 | -804 |
| 1960 | -20 | -824 |
| 1961 | -25 | -849 |
| 1962 | -5 | -854 |
| 1963 | -20 | -874 |
| 1964 | -11 | -885 |
| 1965 | -8 | -893 |
| 1966 | -6 | -899 |
| 1967 | -5 | -904 |
| 1968 | -8 | -912 |
| 1969 | -14 | -926 |
| 1970 | -18 | -944 |
| 1971 | -14 | -958 |
| 1972 | -10 | -968 |
| 1973 | -5 | -973 |
| 1974 | -5 | -978 |
| 1975 | -8 | -986 |
| 1976 | -10 | -996 |
| 1977 | -8 | -1004 |
| 1979 | -6 | -1010 |
| 1980 | -10 | -1020 |
| 1984 | -10 | -1030 |
| 1985 | -5 | -1035 |
| 1987 | -2 | -1037 |
| 1988 | -13 | -1050 |
| 1989 | 10 | -1040 |
| 1990 | 3 | -1037 |
| 1994 | -1 | -1038 |
| 1995 | 0 | -1038 |
| 1996 | -7 | -1045 |
| 1997 | 3 | -1042 |
| 1998 | -7 | -1049 |
| 1999 | 1 | -1048 |
| 2001 | -12 | -1060 |
| 2003 | -19 | -1079 |
| 2004 | -5 | -1084 |
| 2006 | -16 | -1100 |
| 2007 | -1 | -1101 |
| 2008 | -7 | -1108 |
| 2009 | -5 | -1113 |
| 2010 | -14 | -1127 |
| 2011 | -5 | -1132 |
| 2013 | -17 | -1149 |
| 2014 | -13 | -1162 |
| 2016 | -12 | -1174 |
| 2017 | -6 | -1180 |
| 2018 | -28 | -1208 |
| 2019 | -4 | -1212 |
| 2020 | -7 | -1219 |
| 2021 | -24 | -1243 |
| 2022 | -18 | -1261 |
| 2023 | -15 | -1276 |
1949 - 2022
| Year | Winter balance (m.w.e.) | Summer balance (m.w.e.) | Annual balance (m.w.e.) |
|---|---|---|---|
| 1949 | 2.28 | -2.08 | 0.20 |
| 1950 | 1.52 | -1.81 | -0.29 |
| 1951 | 1.13 | -1.67 | -0.54 |
| 1952 | 1.44 | -1.13 | 0.31 |
| 1953 | 1.40 | -2.25 | -0.85 |
| 1954 | 1.21 | -1.98 | -0.77 |
| 1955 | 1.57 | -2.06 | -0.49 |
| 1956 | 1.31 | -1.48 | -0.17 |
| 1957 | 1.42 | -1.37 | 0.05 |
| 1958 | 1.54 | -1.62 | -0.08 |
| 1959 | 1.07 | -2.35 | -1.28 |
| 1960 | 0.98 | -2.07 | -1.09 |
| 1961 | 1.10 | -1.62 | -0.52 |
| 1962 | 1.54 | -0.82 | 0.72 |
| 1963 | 0.96 | -2.14 | -1.18 |
| 1964 | 1.16 | -0.95 | 0.21 |
| 1965 | 1.54 | -1.20 | 0.34 |
| 1966 | 1.25 | -1.86 | -0.61 |
| 1967 | 1.89 | -1.17 | 0.72 |
| 1968 | 1.64 | -1.59 | 0.05 |
| 1969 | 1.22 | -2.64 | -1.42 |
| 1970 | 0.97 | -1.69 | -0.72 |
| 1971 | 1.46 | -1.28 | 0.18 |
| 1972 | 1.39 | -1.70 | -0.31 |
| 1973 | 1.48 | -1.40 | 0.08 |
| 1974 | 1.26 | -1.02 | 0.24 |
| 1975 | 1.55 | -1.70 | -0.15 |
| 1976 | 1.81 | -1.90 | -0.09 |
| 1977 | 0.94 | -1.48 | -0.54 |
| 1978 | 1.26 | -1.70 | -0.44 |
| 1979 | 1.55 | -1.45 | 0.10 |
| 1980 | 0.99 | -2.30 | -1.31 |
| 1981 | 1.30 | -1.40 | -0.10 |
| 1982 | 1.28 | -1.75 | -0.47 |
| 1983 | 1.90 | -1.70 | 0.20 |
| 1984 | 1.70 | -2.00 | -0.30 |
| 1985 | 1.20 | -1.60 | -0.40 |
| 1986 | 1.05 | -1.37 | -0.32 |
| 1987 | 1.55 | -1.23 | 0.32 |
| 1988 | 1.45 | -2.40 | -0.95 |
| 1989 | 2.30 | -1.10 | 1.20 |
| 1990 | 2.60 | -1.34 | 1.25 |
| 1991 | 1.28 | -1.35 | -0.07 |
| 1992 | 1.62 | -1.49 | 0.13 |
| 1993 | 1.82 | -1.01 | 0.81 |
| 1994 | 1.53 | -1.74 | -0.21 |
| 1995 | 1.79 | -1.89 | -0.10 |
| 1996 | 0.83 | -1.80 | -0.97 |
| 1997 | 1.77 | -2.74 | -0.96 |
| 1998 | 1.55 | -1.33 | 0.22 |
| 1999 | 1.67 | -1.90 | -0.24 |
| 2000 | 2.04 | -1.49 | 0.55 |
| 2001 | 1.04 | -1.32 | -0.28 |
| 2002 | 1.09 | -2.87 | -1.79 |
| 2003 | 1.07 | -2.78 | -1.72 |
| 2004 | 0.97 | -1.71 | -0.74 |
| 2005 | 1.77 | -2.04 | -0.23 |
| 2006 | 0.81 | -3.08 | -2.27 |
| 2007 | 1.30 | -1.81 | -0.51 |
| 2008 | 1.90 | -2.01 | -0.10 |
| 2009 | 1.60 | -1.83 | -0.22 |
| 2010 | 0.79 | -2.55 | -1.76 |
| 2011 | 0.99 | -2.57 | -1.58 |
| 2012 | 1.68 | -1.62 | 0.06 |
| 2013 | 1.31 | -2.47 | -1.16 |
| 2014 | 1.57 | -2.74 | -1.17 |
| 2015 | 1.52 | -1.03 | 0.49 |
| 2016 | 1.10 | -1.91 | -0.80 |
| 2017 | 1.17 | -1.69 | -0.52 |
| 2018 | 1.27 | -3.24 | -1.97 |
| 2019 | 1.02 | -2.54 | -1.52 |
| 2020 | 1.93 | -1.98 | -0.05 |
| 2021 | 1.37 | -3.04 | -1.67 |
| 2022 | 1.35 | -2.03 | -0.68 |