Climate indicator products
Home > Climate indicator products
Other glacier products:
Glacier photos
Langfjordjøkelen - 54

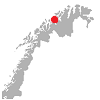
Langfjordjøkelen is a plateau glacier in Troms og Finnmark. Mass balance has been measured on the east-facing outlet since 1989 (except 1994 and 1995). Length change measurements started in 1998. The serie was extended using maps from 1966 and 1994.
Click here for more information about the glacier.1907 - 2018
| Year | area (km²) |
Source |
|---|---|---|
| 1907 | 20.63 | Gradteigskart' |
| 1966 | 9.82 | N50 |
| 1988 | 8.3 | Landsat |
| 1994 | 8.44 | Aerial photo |
| 2006 | 7.49 | Landsat |
| 2008 | 7.69 | LiDAR |
| 2018 | 6.17 | LiDAR |
1966 - 2023
| Year | Length change (m) | Cumulative length change (m) |
|---|---|---|
| 1966 | 0 | Start |
| 1994 | -694 | -694 |
| 1998 | -121 | -815 |
| 1999 | -39 | -854 |
| 2000 | -12 | -866 |
| 2001 | -25 | -891 |
| 2002 | -62 | -953 |
| 2003 | -37 | -990 |
| 2004 | -17 | -1007 |
| 2005 | -29 | -1036 |
| 2006 | -35 | -1071 |
| 2007 | -51 | -1122 |
| 2008 | -12 | -1134 |
| 2009 | -53 | -1187 |
| 2010 | -15 | -1202 |
| 2011 | -10 | -1212 |
| 2012 | -20 | -1232 |
| 2013 | -10 | -1242 |
| 2014 | -51 | -1293 |
| 2015 | 6 | -1287 |
| 2016 | -96 | -1383 |
| 2017 | -11 | -1394 |
| 2018 | -36 | -1430 |
| 2019 | -11 | -1441 |
| 2020 | -15 | -1456 |
| 2021 | -19 | -1475 |
| 2022 | -61 | -1536 |
| 2023 | -66 | -1602 |
1989 - 2022
| Year | Winter balance (m.w.e.) | Summer balance (m.w.e.) | Annual balance (m.w.e.) |
|---|---|---|---|
| 1989 | 2.38 | -2.98 | -0.60 |
| 1990 | 2.60 | -2.98 | -0.38 |
| 1991 | 2.25 | -2.29 | -0.04 |
| 1992 | 2.58 | -2.37 | 0.22 |
| 1993 | 2.49 | -2.34 | 0.15 |
| 1996 | 2.23 | -2.24 | -0.01 |
| 1997 | 2.76 | -3.43 | -0.66 |
| 1998 | 1.80 | -3.27 | -1.47 |
| 1999 | 1.33 | -3.02 | -1.68 |
| 2000 | 2.53 | -3.05 | -0.52 |
| 2001 | 1.46 | -3.64 | -2.18 |
| 2002 | 2.36 | -3.67 | -1.31 |
| 2003 | 2.44 | -3.39 | -0.95 |
| 2004 | 1.81 | -3.50 | -1.69 |
| 2005 | 1.95 | -2.97 | -1.02 |
| 2006 | 1.39 | -3.59 | -2.20 |
| 2007 | 2.15 | -2.79 | -0.64 |
| 2008 | 1.58 | -2.01 | -0.43 |
| 2009 | 1.93 | -3.25 | -1.31 |
| 2010 | 1.89 | -2.64 | -0.75 |
| 2011 | 2.30 | -3.55 | -1.26 |
| 2012 | 1.37 | -2.13 | -0.76 |
| 2013 | 2.08 | -4.69 | -2.62 |
| 2014 | 2.39 | -2.95 | -0.56 |
| 2015 | 1.92 | -2.57 | -0.65 |
| 2016 | 1.72 | -3.23 | -1.51 |
| 2017 | 2.12 | -2.15 | -0.03 |
| 2018 | 1.54 | -3.67 | -2.13 |
| 2019 | 2.51 | -2.89 | -0.38 |
| 2020 | 2.74 | -2.76 | -0.02 |
| 2021 | 2.20 | -2.40 | -0.20 |
| 2022 | 2.65 | -4.56 | -1.91 |